DevTools Network Tab
DevTools is a set of web development and debugging tools built into modern browsers. Chrome specifically calls this DevTools while Firefox refers to this collection as Web Developer Tools. These tools are primarily useful when doing frontend web development. One feature of DevTools is useful for backend development — the Network Tab.
This article covers the Network Tab functionality in the Chrome browser. Similar functionality exists in Firefox or other major browsers. You can open Dev Tools in Chrome by navigating to More Tools → Developer Tools. This document lists only the most common features available in the Network Tab, for more information see the Chrome DevTools documentation.
Network Tab
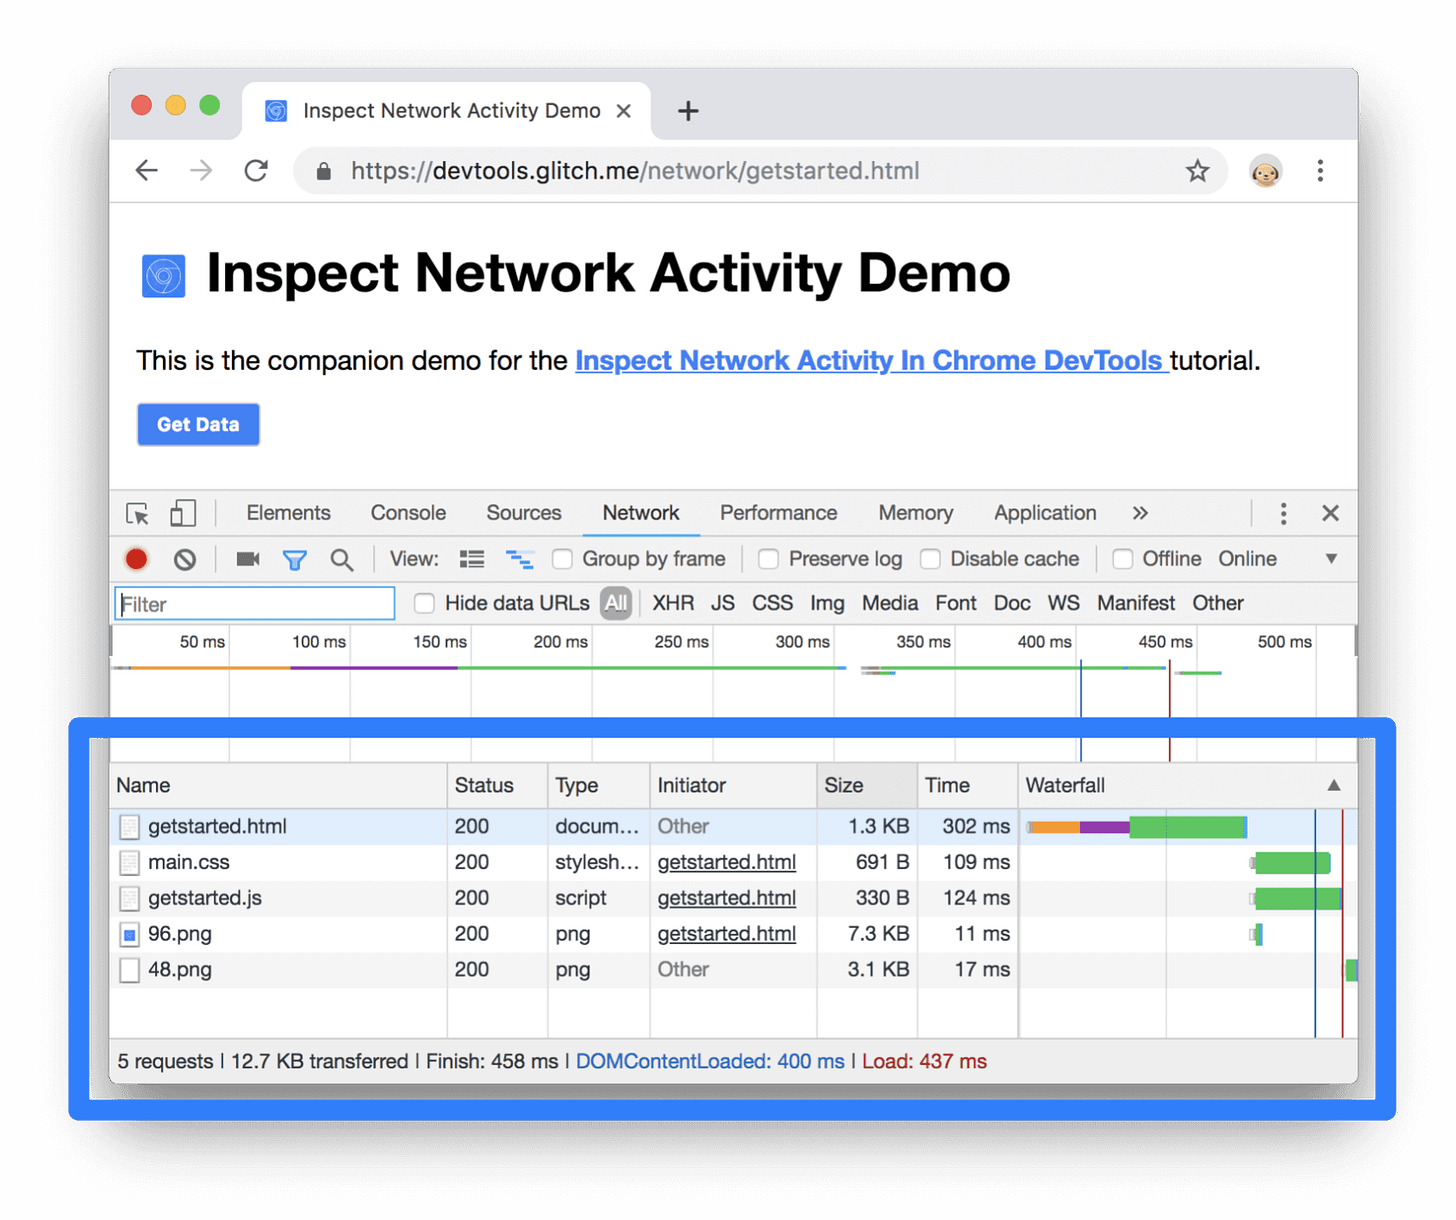
The Network tab in the Chrome DevTools is a powerful tool that allows developers to monitor and analyze the network activity of a web page or application. It provides insights into the resources loaded by the browser, including HTML, CSS, JavaScript, images, fonts, and network requests made by AJAX calls or API interactions.
The Network tab displays a list of network requests made by the page, including their URLs, HTTP methods, status codes, sizes, and timings. The Network tab can be used to analyze the performance of a webpage or application. It provides insights into the loading order of resources, identifies potential bottlenecks, and helps optimize network-related aspects of a web page. This information is available in the Waterfall column. This column provides detailed timing information for each request, including the time taken for DNS resolution, TCP connection, SSL negotiation (if applicable), sending the request, waiting for a response, and receiving the response.
You can filter requests based on various criteria such as file type, domain, status code, or search keywords. Sorting options allow you to organize requests by different attributes like size, time, or domain.
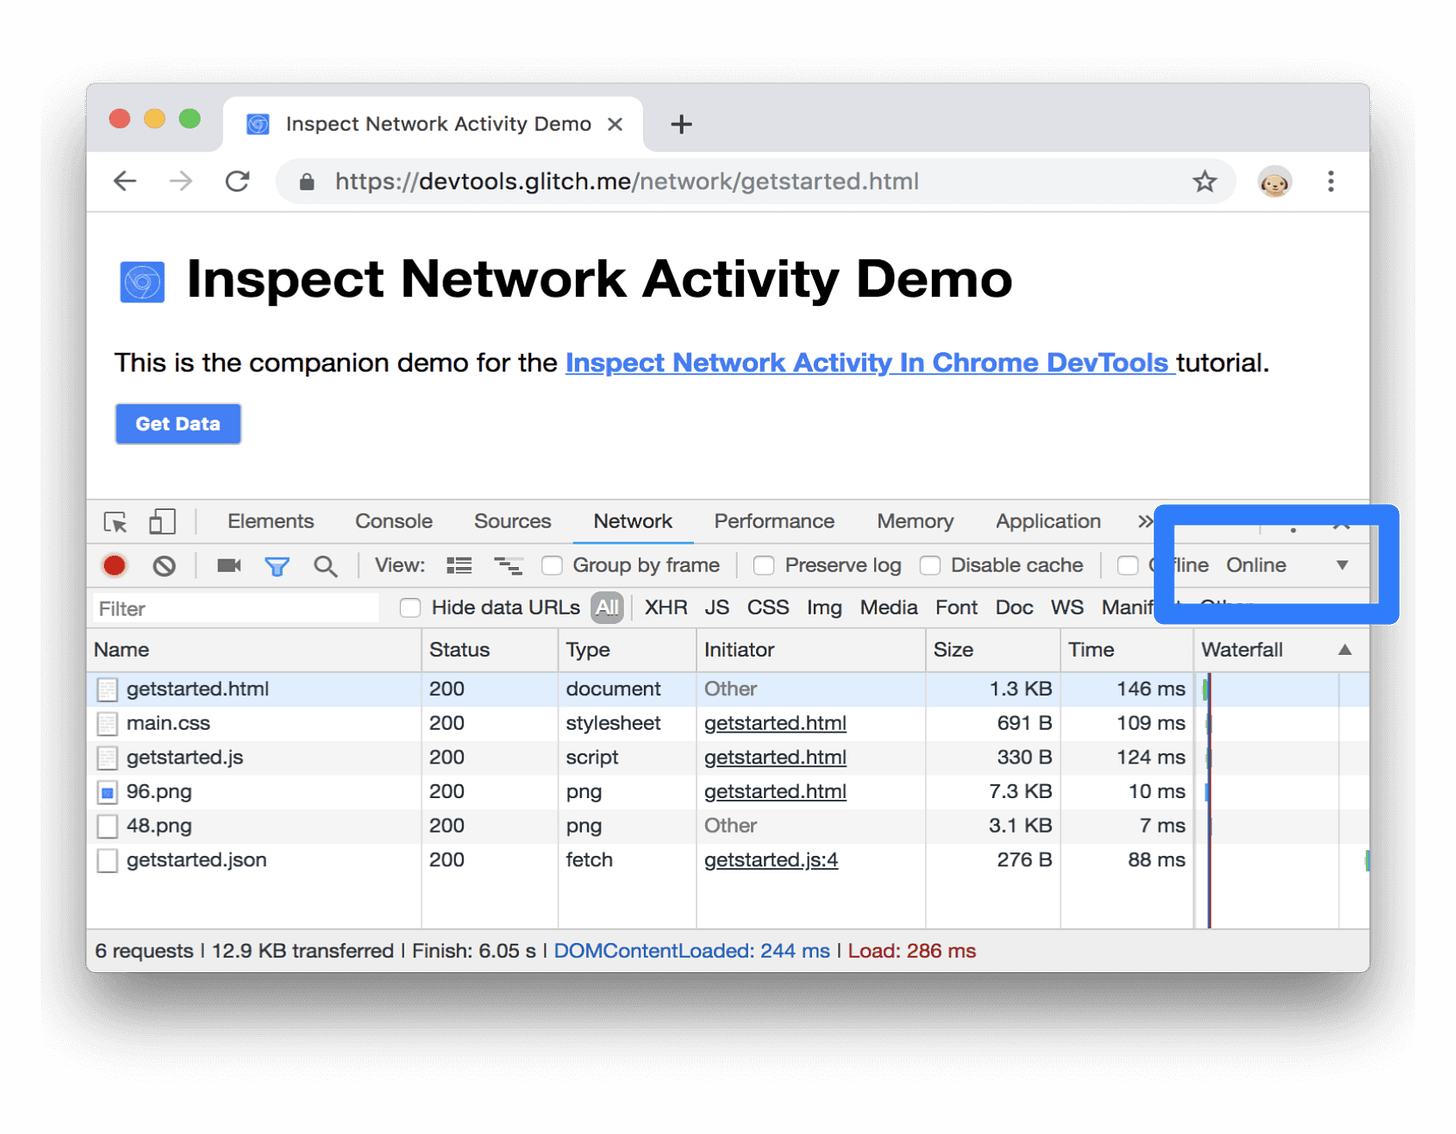
The DevTools allow you to simulate different network conditions by throttling the network speed. This feature helps you understand how your web page or application behaves under slow or limited network connections.
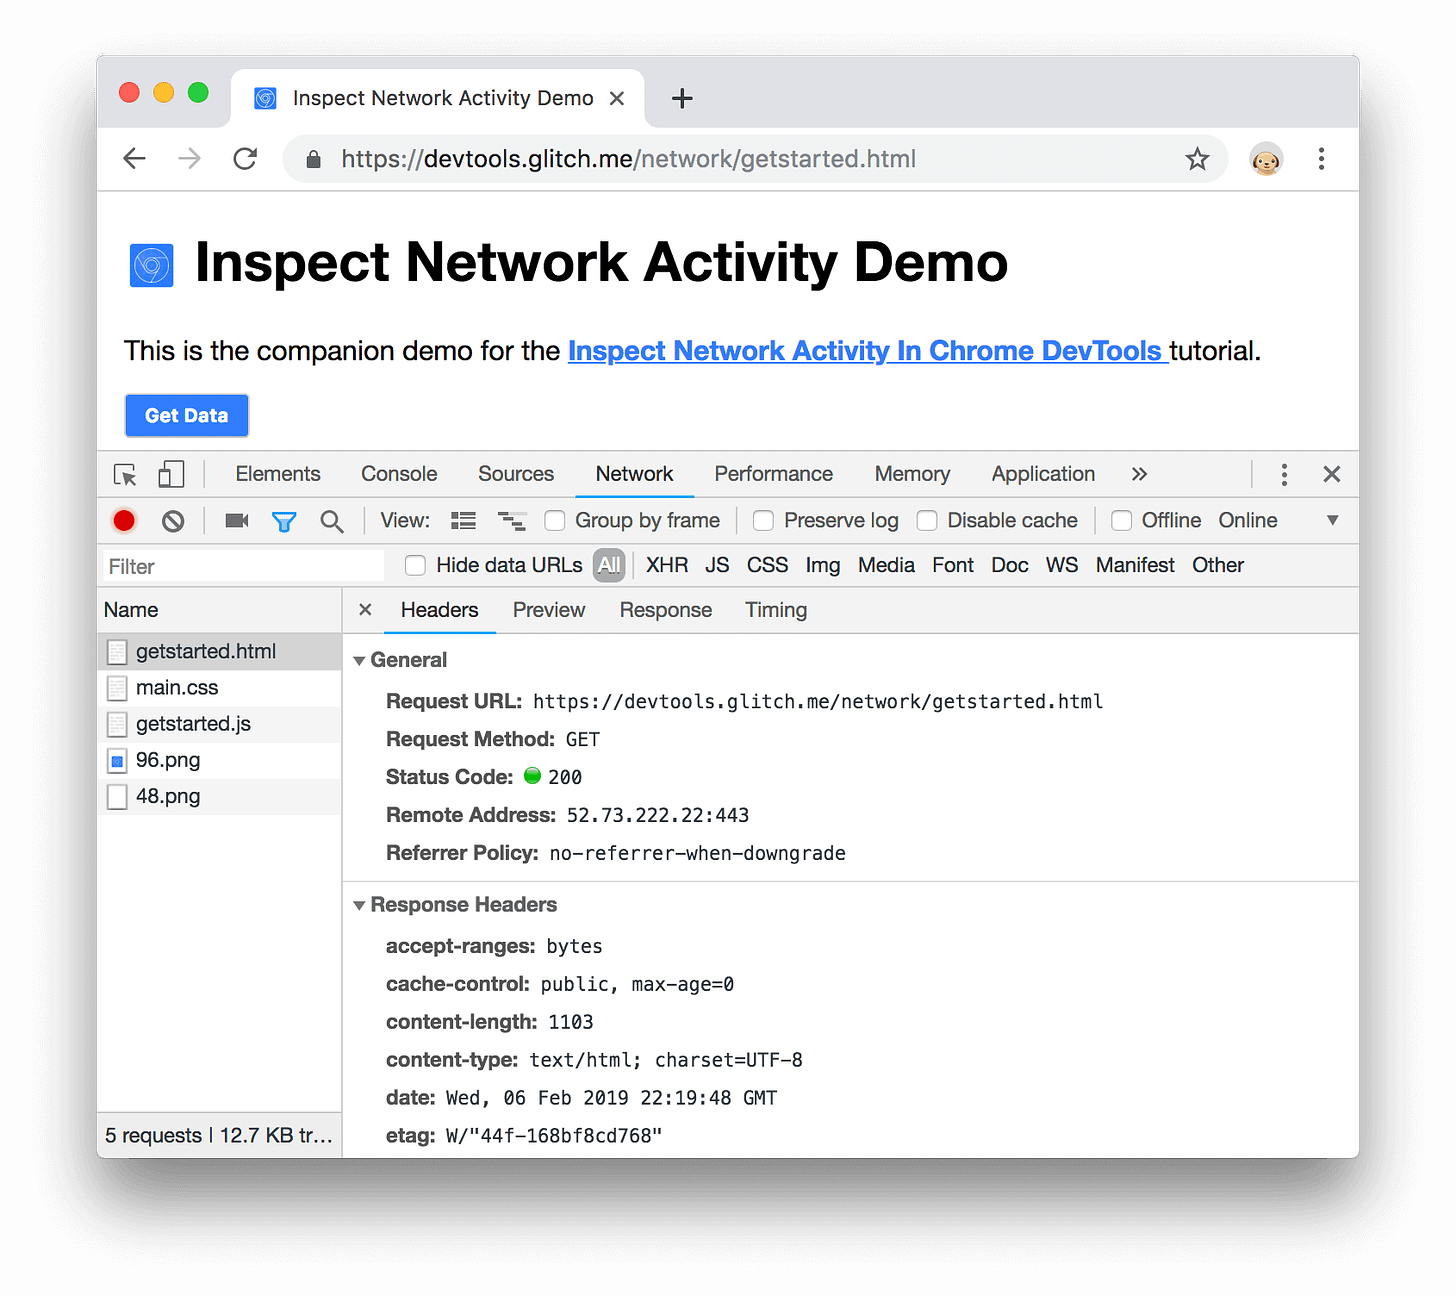
You can view the headers sent in the request and the headers received in the response. This information is useful for debugging and troubleshooting network-related issues.
You can preview the content of various types of responses directly within the DevTools, including HTML, JSON, images, and more. This feature helps in quickly inspecting the response data without leaving the development environment.


